Small and medium-sized businesses (SMBs) are growing, and with this growth, they’re changing the way they use technology to run their businesses. However, with their purse strings drawn tight and not having a clear road map of IT implementation, SMBs generally invest in IT in a phased manner. The problem manifolds for them as th? present market only offers solutions that are either expensive and bloated or open-source with a great need for fine-tuning and customizing. With limited knowledge of technology and their budgets tight, none of the options seem feasible for SMBs.
This is where a product like Anturis comes in. Promising features at par with enterprise-level IT monitoring softwares, without the exorbitant prices that generally accompany them, Anturis sounds like a pretty solid service that can play a strategic role in businesses of all sizes, helping companies do more with less to realize cost savings and profitability.
Modus-operandi
Configuring Anturis is an easy task and requires little effort. Once you create your account, you can choose which component of your infrastructure you want to monitor, including server, desktop, database, firewall, printer, application etc. You can do so easily on the main page of the Anturis control panel.
We chose to monitor one of our servers based in Mumbai, India. Once we chose it as a component, it became listed on the left side of the control panel as well as appeared as an icon in the main area, clicking on which showed the results of the monitoring session (more on it later).
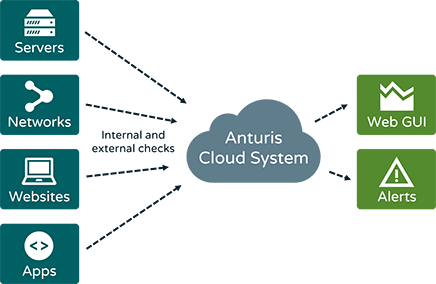
In order to monitor servers, a Private Agent needs to be installed on your system. The Private Agent sends collected data to the Anturis service via a secure HTTP connection to the Anturis cloud data center. A special agent software first needs to be downloaded from the Locations&Agents tab in the Anturis Console. The Agent installation (as well as all its subsequent maintenance) can be done easily with its own desktop GUI . Your user account credentials are required to connect the agent to the Anturis service. Once we supplied the correct information, the agent got connected and became visible in the list of ‘Available agents’ at the Anturis control panel.
The modus-operandi of the Anturis Private Agent is better shown in the figure below:
After installing the Private Agent, you need to create a person who’ll be notified in case of problems. Notifications can be delivered via email, SMS or phone call, and the notification method depends on problem severity. Once you assign a newly created person to be responsible for an application, you can also configure various other factors to customize the monitoring as per your needs, like the Error threshold, Monitor Period (the time interval between two subsequent checks of a monitored object) etc.
Over the next few days, we received regular daily status emails including a couple of warnings about problems with the server. We were also able to access the daily log report form the Anturis control panel.
Conclusion
As mentioned earlier, configuring Anturis is straightforward and doesn’t require technical skills. It monitored our web services effectively, from both user and infrastructure perspective, and provided us with truly valuable information and immediate feedback about errors that could have cost us significant time, resources and money, had they not been addressed timely.
Delivering features at par with enterprise-level IT monitoring softwares, without the grotesquely high prices that generally accompany them, Anturis comes across as an affordable, compressive and a very promising product, especially for the SMBs who cannot afford to spend an exorbitant amount of money on monitoring IT services.
Anturis was in the Beta at the time we used it for monitoring out infrastructure and is now available commercially with various new features and enhancements. There is also a free plan available for those who want to use limited services. For more details, click here.


